
As an ISO/IEC 17025 accredited (CNAS) independent laboratory, we provide comprehensive Foreign Object Debris analysis services for the Algerian aerospace, automotive, defense, electronics and heavy manufacturing sectors. FOD refers to any foreign substance, particle, or object not originally part of a manufactured product or assembly. Our analysis identifies the chemical composition, morphology, size distribution, and possible origin of contaminants found on critical components, production lines, or during incoming inspection. These results help manufacturers implement corrective actions, reduce rejection rates, and comply with international quality management standards such as AS9100 (aerospace) and IATF 16949 (automotive).
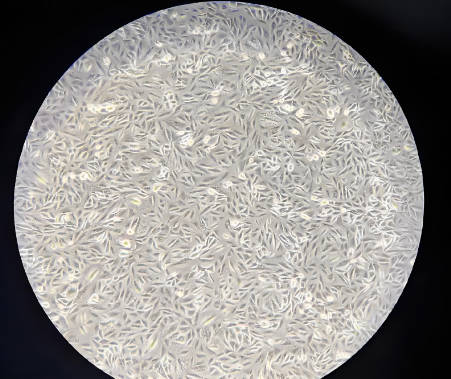
Types of Foreign Object Debris We Regularly Analyze
- Metal chips, turnings, and burrs from machining operations (steel, aluminum, titanium, copper alloys, brass, bronze)
- Swarf, grinding dust, and polishing residues (abrasive particles, wheel fragments, buffing compound residues)
- Welding spatter, slag, and electrode residues (including tungsten, mild steel, stainless steel, aluminum droplets)
- Rubber and elastomer fragments (from seals, gaskets, belts, hoses, tires)
- Plastic and polymer particles (film fragments, flash, sprue remnants, shredded edges from trimming)
- Glass and ceramic fragments (from broken tools, windows, insulators, grinding wheels, sandblasting media)
- Textile fibers and lint (cotton, polyester, nylon, aramid, wool from cleaning rags, gloves, protective clothing)
- Paper and cardboard debris (from packaging, labels, shipping materials, gaskets)
- Sand, dust, and environmental particulates (silica, clay, airborne soil, atmospheric fallout)
- Biological contaminants (insect fragments, mold spores, bacterial colonies, hair, skin flakes, dried fluids)
- Flux residues, solder splashes, and rosin particles (electronics assembly, wave soldering, hand soldering)
- Coating flakes and paint chips (overspray, peeling from fixtures or painted enclosures)
- Corrosion products (rust, oxides, sulfides, chlorides, tarnish films)
- Lubricant and grease residues with embedded wear particles (oil degradation products, metallic fines)
Collection and Sample Preparation Techniques
- Adhesive tape lift method (pressure sensitive tape or carbon conductive tape) – A piece of clear adhesive tape is pressed onto the contaminated surface and gently lifted. The tape is mounted directly onto a glass slide or aluminum stub for microscopic and spectroscopic analysis. This method is non‑destructive to the component and excellent for loose particles.
- Vacuum extraction (filtration onto membrane filters) – A vacuum cleaner fitted with a high‑efficiency particulate air (HEPA) filter and a collection nozzle is used to sweep the surface. Particles are collected onto a pre‑weighed membrane filter (polycarbonate, mixed cellulose ester, or PTFE, typically 0.45 µm or 5 µm pore size). The filter is dried and examined. This method is suitable for large areas such as assembly lines or warehouse floors.
- Solvent rinse and filtration (washdown method) – The component or surface is rinsed with a clean solvent (isopropanol, ethanol, acetone, hexane, or deionized water). The rinsate is passed through a filter membrane to capture particles. The residue on the filter is analyzed. This is the preferred method for internal cavities, blind holes, and complex geometries.
- Ultrasonic extraction in solvent – The component is immersed in a beaker of clean solvent and placed in an ultrasonic bath for 5 to 15 minutes. The solvent is then filtered through a membrane. Ultrasonic energy dislodges adherent particles and residues, especially in crevices and threaded areas.
- Direct visual picking under stereomicroscope (for large or visible FOD) – A clean pair of tweezers or a needle is used to manually lift a visible foreign object. The object is placed directly onto a double‑sided carbon tape mounted on an aluminum stub. This method preserves the original three‑dimensional morphology of the particle.
- Magnetic separation (for ferromagnetic particles) – A clean magnet (covered with a polyethylene film) is passed over the surface or through the rinse solution to attract ferromagnetic debris. Captured particles are examined separately. Useful for distinguishing iron‑based wear debris from non‑ferrous contaminants.
- Density separation (gravity settling or centrifugation) – Used when FOD is suspended in a liquid medium. The suspension is allowed to settle or is centrifuged. The sediment is collected and analyzed. This method concentrates heavier particles.
Preliminary Examination – Visual and Low‑Magnification Inspection
- Stereo microscopy (magnification 10× to 100×) – All collected FOD samples are first examined under a stereomicroscope with both reflected and transmitted light. Observations include: overall quantity of particles, size range (approximate dimensions in micrometers or millimeters), shape characteristics (angular, rounded, fibrous, irregular), color, luster (metallic, dull, transparent), and presence of magnetic attraction.
- Particle counting and size classification by image analysis – For quantitative assessment, images of the filter membrane are captured by a digital camera attached to the microscope. Image analysis software counts particles automatically and classifies them into size bins (e.g., 5–15 µm, 15–50 µm, 50–100 µm, 100–200 µm, >200 µm). Results are expressed as number of particles per unit area (e.g., particles/cm²) or per component.
- Category coding (inspection log sheet) – Each particle is assigned a tentative category based on visual appearance: metal chip, plastic shred, fiber, glass fragment, sand grain, rubber piece, paint flake, etc. This preliminary classification guides subsequent confirmatory analysis.
- Darkfield and polarized light observation – Polarized light microscopy helps identify birefringent materials such as certain plastics, fibers, and minerals. Darkfield illumination enhances contrast for transparent or low‑contrast particles.
Chemical Composition Analysis – Identification of Material Type
- Scanning electron microscopy with energy‑dispersive X‑ray spectroscopy (SEM‑EDS) – Each particle or a representative subset of particles is transferred to a carbon adhesive stub, sputter‑coated with gold or carbon (if required), and examined under high vacuum. Backscattered electron (BSE) imaging distinguishes regions of different average atomic number (brighter = higher atomic number). EDS analysis provides semi‑quantitative elemental composition from boron (B) to uranium (U). For metallic particles, we report the major elements (Fe, Cr, Ni, Mo, Al, Cu, Zn, Ti, etc.) and minor/trace elements. For non‑metallic particles, we report elements such as C, O, Si, Ca, Al, Mg, S, Cl, Na, K.
- Fourier transform infrared spectroscopy (FTIR) – micro‑ATR mode – For organic particles such as plastics, rubbers, fibers, adhesives, and lubricant residues. The particle is placed on the diamond ATR crystal and pressed. An infrared spectrum is collected from 4000 cm⁻¹ to 650 cm⁻¹. The spectrum is compared against reference libraries containing thousands of polymers, elastomers, and organic compounds. A match report includes the material family (e.g., polyamide, polycarbonate, silicone rubber, polyethylene, polypropylene, polyurethane, epoxy, acrylic, polyester, cellulose, polytetrafluoroethylene).
- Raman microspectroscopy – Complementary to FTIR, Raman spectroscopy is particularly useful for carbonaceous materials (carbon black, graphite, diamond), inorganic pigments, and particles that are too small or too strongly absorbing for ATR‑FTIR. The particle is excited by a laser (typically 532 nm or 785 nm), and the scattered light is analyzed.
- Micro X‑ray fluorescence (micro‑XRF) – For particles embedded in filters or mounted on tape, micro‑XRF provides elemental mapping without the need for vacuum. Especially useful for detecting heavy elements (lead, mercury, cadmium, tin, antimony, bromine) and for layered particles where SEM‑EDS depth resolution is insufficient.
- Pyrolysis‑gas chromatography‑mass spectrometry (Py‑GC‑MS) – For very small organic particles or complex mixtures (e.g., a plastic particle containing multiple additives). The particle is rapidly heated (pyrolyzed) in an inert atmosphere, and the resulting fragments are separated by gas chromatography and identified by mass spectrometry. This method can identify polymer type and detect additives such as plasticizers, flame retardants, and antioxidants.
Source Determination and Root Cause Interpretation
Once the chemical composition and morphology of the FOD are known, our material scientists and failure analysts work to trace the particle back to its most likely origin. This is often the most valuable part of the service for manufacturers seeking to eliminate recurring contamination.
- Morphological comparison with known manufacturing process residues – A metal chip with a characteristic curled shape and tooling marks suggests a machining operation. A spherical metallic particle with a smooth surface and internal porosity indicates welding spatter. A flake with a layered structure and organic binder may be a paint chip from a painted fixture or wall. A transparent angular fragment with conchoidal fracture is likely glass. A spherical glass bead indicates sandblasting media.
- Elemental fingerprinting (trace element ratios) – For metal particles, the ratio of alloying elements (e.g., Cr/Fe, Ni/Cr, Mo/V) can be compared to the known composition of different steel grades used in the facility (tool steel, stainless steel, carbon steel, high‑speed steel, nickel alloys). Similarly, the ratio of Ca, Mg, Al, Si in a dust particle can suggest a specific raw material (e.g., cement dust, limestone, clay, talc).
- Corrosion product identification – Red/orange iron oxide (hematite) indicates rust from carbon steel. Yellow/brown iron oxide (goethite) indicates long‑term atmospheric corrosion. Black magnetite suggests high‑temperature oxidation. Green copper corrosion products (basic copper carbonate, copper chloride) indicate exposure to moisture and chlorides. White zinc corrosion products (zinc hydroxide, zinc carbonate) are common on galvanized surfaces.
- Fiber identification by polarized light microscopy (PLM) and FTIR – Cotton fibers appear as flattened twisted ribbons under the microscope; polyester fibers are smooth, cylindrical, and uniform; aramid fibers (Kevlar) are golden yellow and highly birefringent; glass fibers are transparent with a smooth cylindrical shape and no birefringence. FTIR confirms the polymer type. The color and morphology of fibers can be matched to cleaning wipes, gloves, protective clothing, or air filters in the production environment.
- Comparison with known tooling and consumable materials – We request from the client representative samples of all materials present in the production environment: tool inserts (carbide, high‑speed steel), grinding wheels (aluminum oxide, silicon carbide, cubic boron nitride), blasting media (glass beads, aluminum oxide, steel grit, walnut shells), polishing compounds (diamond paste, aluminum oxide slurry, chromium oxide, cerium oxide), cleaning wipes, gloves, tapes, labels, and packaging materials. Reference spectra and elemental fingerprints of these materials are collected and stored in our internal library. FOD particles are compared directly against this library. A match indicates the probable source with high confidence.
Reporting and Data Presentation
Each Foreign Object Debris analysis report includes the following sections:
- Sample identification and context – Part name, component number, production stage where FOD was discovered, cleaning or assembly process step, date of occurrence, and any information provided by the client about potential sources.
- Collection method description – Tape lift, solvent rinse and filtration, vacuum extraction, ultrasonic extraction, or direct picking. Area sampled (cm²) or volume of rinse solvent (mL) is recorded.
- Particle enumeration and size distribution (if applicable) – Total particle count, particle count per unit area, and a histogram showing the number of particles in each size range.
- Individual particle analysis results – For each representative particle or for all particles above a certain size (e.g., >50 µm), we provide: a high‑magnification SEM image (secondary electron or backscattered electron mode), a full EDS spectrum with elemental peak identification, the calculated weight percentage of each element, a FTIR spectrum (if organic) with library match result, and a morphological description (shape, surface texture, color, transparency, luster).
- Likely source conclusion – Based on the combined evidence, we state the most probable origin of the FOD (e.g., “aluminum chip from CNC milling of 6061 alloy”, “silicon carbide abrasive grain from a grinding wheel”, “polyester fiber from a blue cleanroom wipe”, “welding spatter from manual TIG welding of stainless steel”, “red paint flake from overhead crane beam”, “glass bead from shot blasting cabinet”).
- Recommendations for elimination (if requested) – Suggested corrective actions such as: change of tool material, modification of cleaning procedure, replacement of consumables, installation of covers or screens, improved filtration of cooling lubricant, or increased frequency of line clearance.
No statement of compliance with any external specification or regulatory requirement is included unless the client has provided written acceptance criteria for FOD limits. Raw spectra, images, and instrument calibration records are archived in our quality management system.
Why Choose ZKGX?
- State-of-the-art analytical equipment
- Highly qualified scientific team
- Fast turnaround time
- Competitive pricing